The ability to look beyond historical data is what separates a reactive logistics team from a proactive one. Orbify’s Export and Import modules provide a high-definition view of the global LNG supply chain, blending past performance with future projections.
The most critical feature of these modules is the visual distinction between what has already happened and what is about to happen.
Exported/Imported LNG (Solid Bars): Represents completed operations. This is your "source of truth" for historical auditing and contractual verification.
LNG in Transit (Dashed Outlines): This is your predictive layer. It represents laden vessels that have departed their load port but have not yet reached their destination. For an Import Manager, this is a 14-day "look-ahead" window into upcoming terminal workload.
When viewing the Export LNG Cargo chart, Orbify tracks all laden vessels that have departed the load port (export terminal).
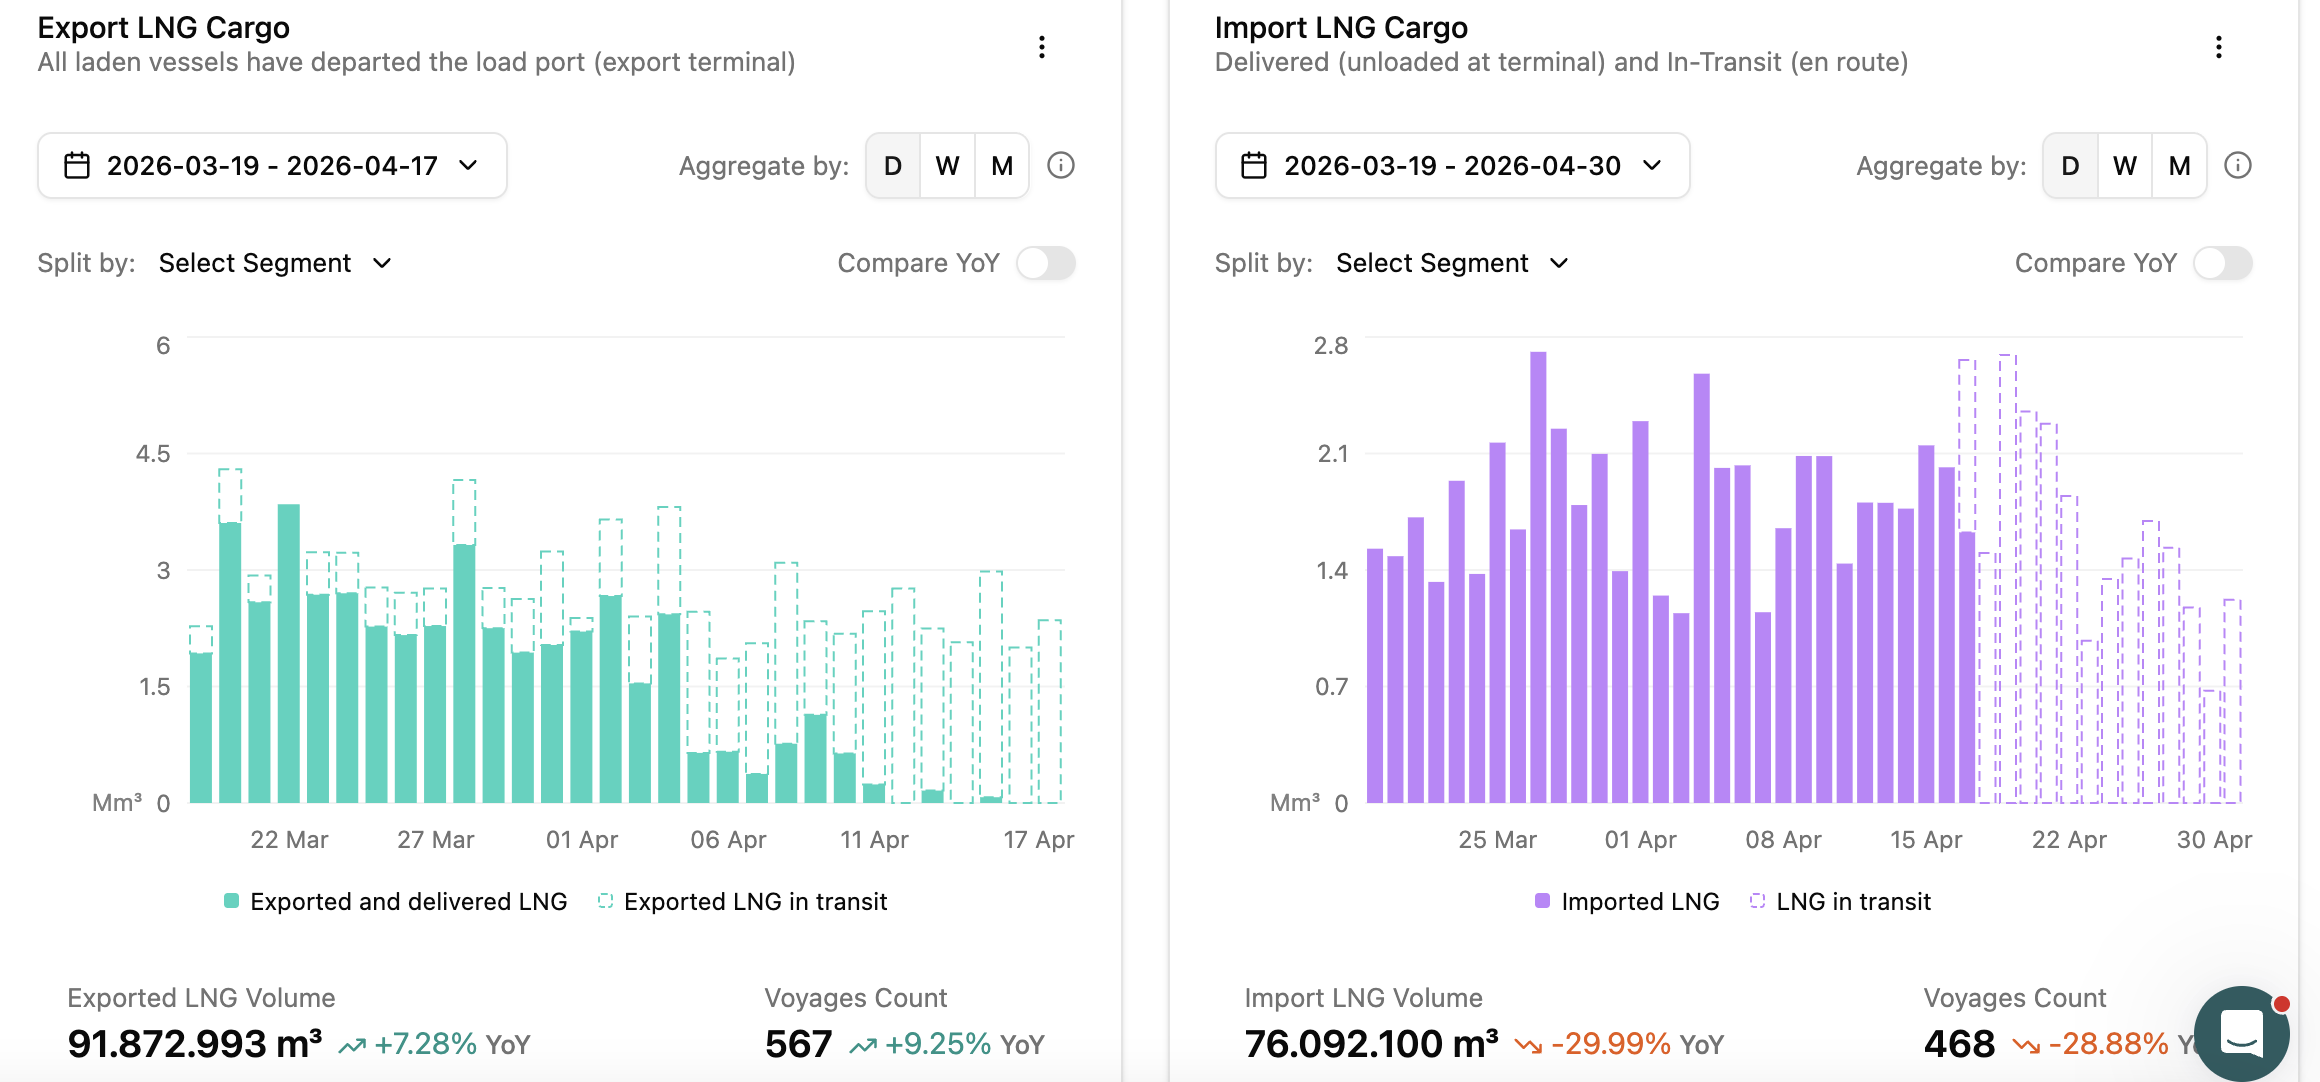
Growth Benchmarking: By looking at the Voyages Count and Exported LNG Volume, you can immediately see the health of the supply side.
Case Study: In our current view, we see a +7.28% YoY increase in exported volume. This suggests a robust supply period, supported by a +9.25% increase in voyage frequency, indicating higher vessel turnover.
The Import LNG Cargo chart monitors delivered and en-route volumes. It is the essential tool for inventory management.
Anticipating Shortfalls: A sharp decline in the Import chart (as seen in the -29.99% YoY figure) serves as an early warning signal. If the "In-Transit" (dashed) bars do not fill the gap, it indicates a tightening of local supply that might require immediate trading action.
Operational Readiness: Knowing exactly how many Mm³ are arriving over the next 10–15 days allows terminals to optimize berth scheduling and regasification rates.
To make sense of these flows, Orbify provides two essential analytical toggles located at the top right of each chart:
Feature | Function | Strategic Value |
Aggregation (D/W/M) | Switches view between Daily, Weekly, or Monthly. | Use Daily for terminal ops; Monthly for board-level reporting. |
YoY Toggle | Superimposes previous year’s data. | Instantly identify if a dip in imports is a seasonal trend or a new anomaly. |
The Orbify Advantage: While most platforms show you where the gas was, Orbify shows you where it is and where it will be. By mastering the "Dashed Bar" projection, logistics teams can transform from data observers into supply chain architects.
