The true power of Orbify lies in its ability to "zoom in" on a single asset to extract critical operational details. In this example, we track the vessel GLOBAL SEALINE to demonstrate how to interpret real-time data.
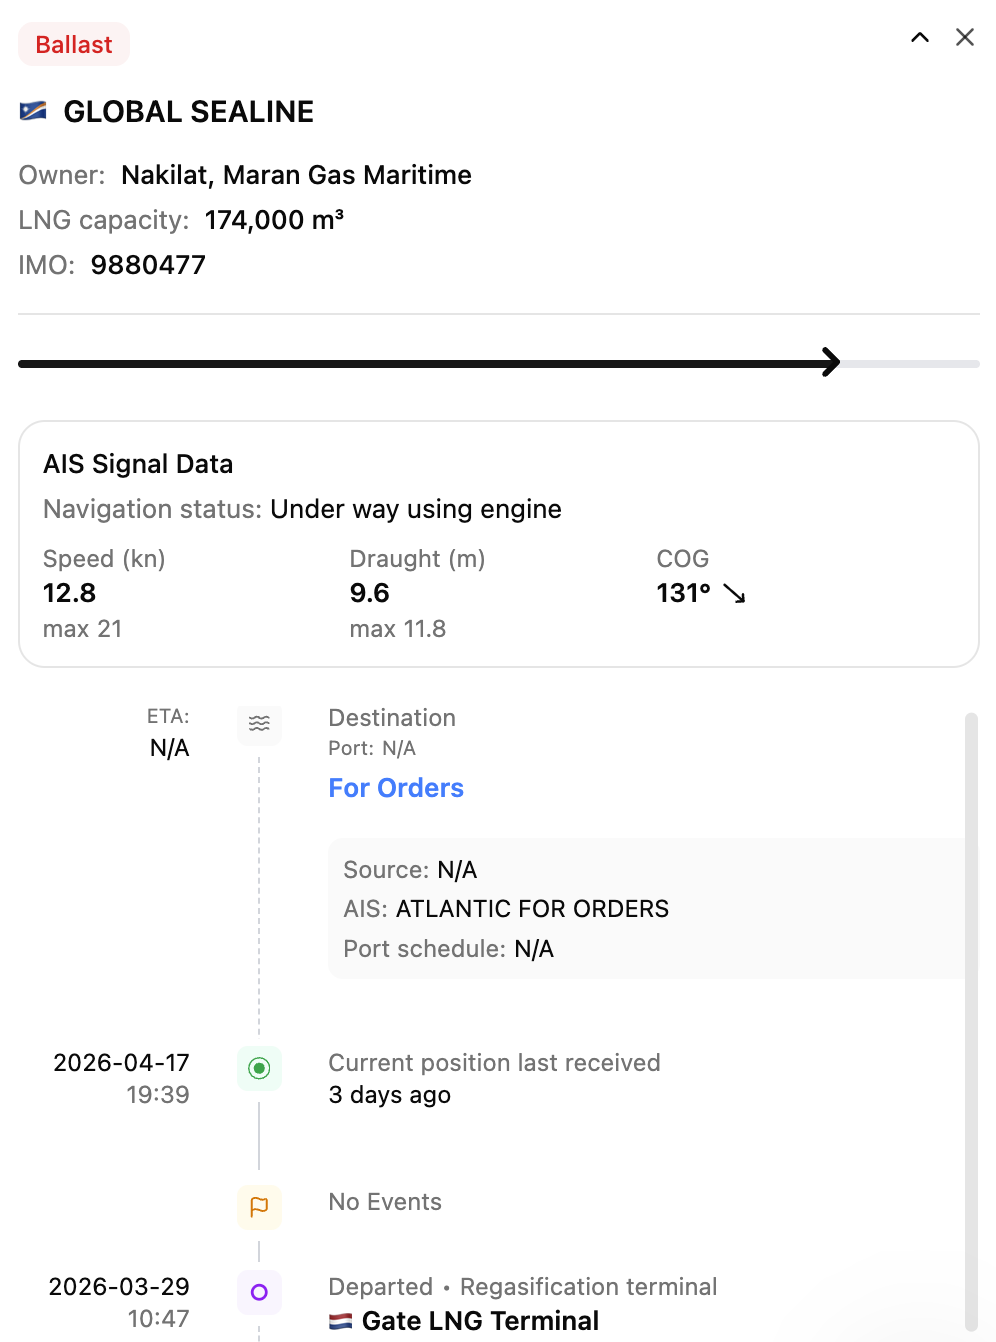
When you click on a vessel on the Live Map, Orbify opens a summary window. This is designed for high-pressure environments where you need the most important facts in seconds.
Vessel Identity: We immediately see the owner (Nakilat, Maran Gas Maritime) and the capacity (174,000 m³).
Status & Speed: The vessel is currently "Under way using engine" at 12.8 knots.
Voyage Logic: The timeline shows the ship departed from Gate LNG Terminal 22 days ago. Currently, the destination is set to "For Orders": a critical piece of intelligence suggesting the cargo is available for spot market trading or awaiting final instructions.
By clicking "Show Details", we enter the deep-analysis mode. Here, Orbify aggregates technical specifications with voyage history.
Identification & Specs: Beyond the name, we get the IMO (9880477) and the year built (2021), confirming this is a modern, efficient LNG carrier.
Performance Benchmarking: We can compare current speed (12.8 kn) against the vessel's max speed (21 kn). This helps analysts understand if a ship is "steaming" to reach a deadline or "eco-speeding" to save fuel while waiting for orders.
Historical Timeline: The detailed voyage schedule tracks every major event, from departure to the last position received, providing a clear audit trail of the vessel’s movements.
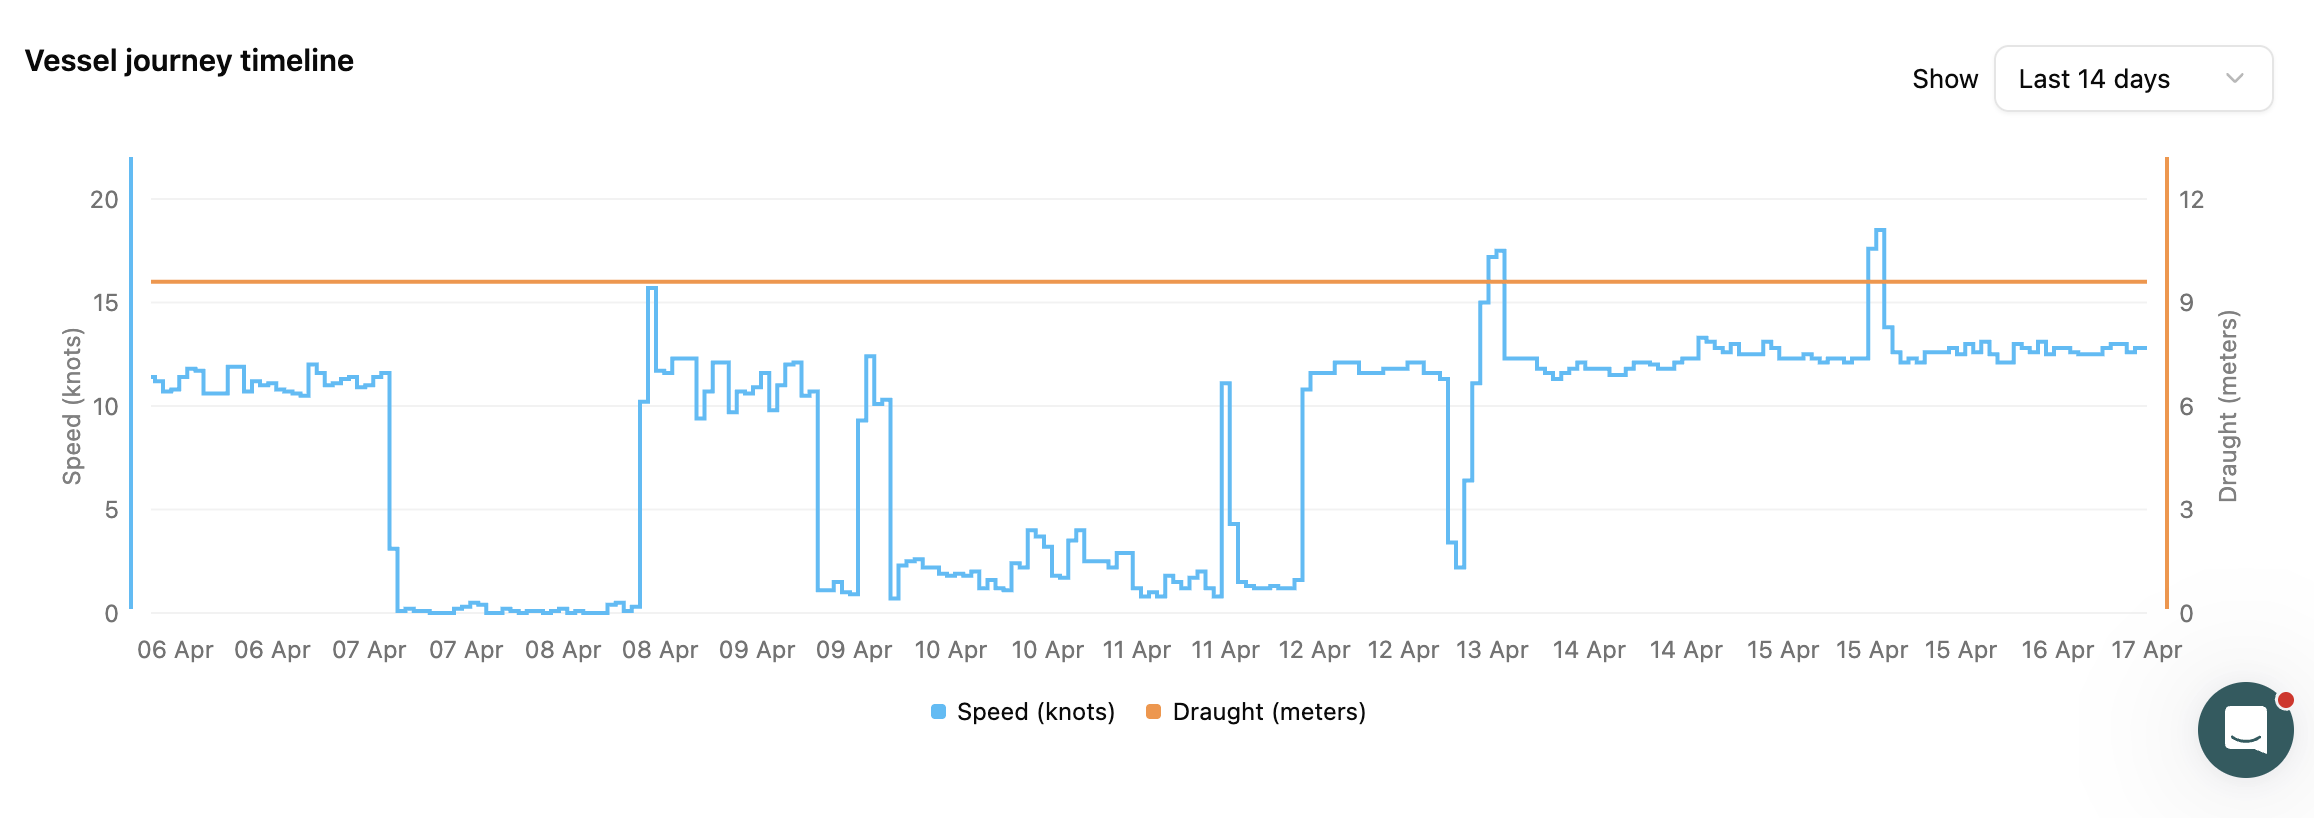
The most technical part of the analysis is the Journey Timeline graph. This chart plots Speed (knots) against Draught (meters) over the last 14 days.
Interpreting Draught (Orange Line): The constant draught around 9.6 meters indicates the vessel’s displacement hasn't changed, confirming it is currently in a "Ballast" state (empty).
Interpreting Speed (Blue Line): Notice the volatility in the blue line. Sharp drops to zero followed by steady cruising at 12 knots suggest the vessel may have been drifting or waiting in anchorage before resuming its journey "For Orders."
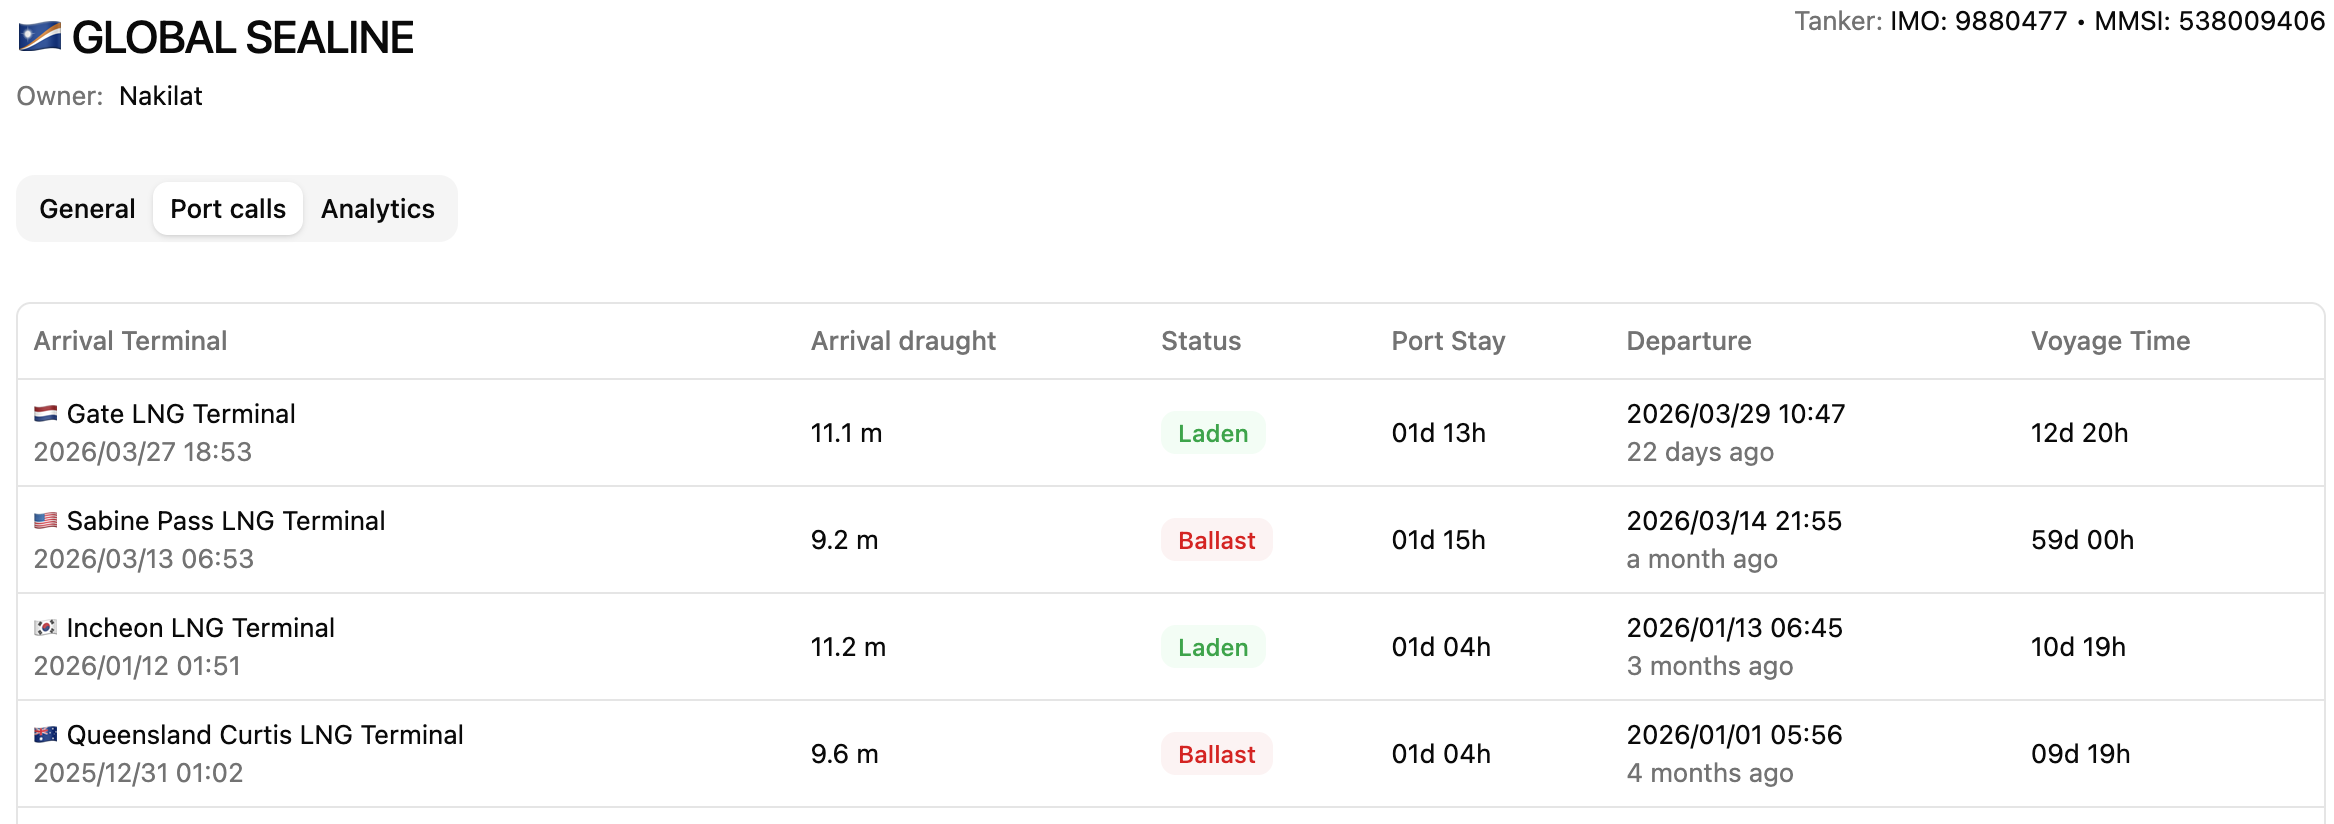
When you click on the Port Calls view, Orbify unlocks a comprehensive historical log of the vessel’s interactions with global terminals. This view is essential for auditing operational efficiency and reconstructing the asset's commercial cycle.
Arrival Status & Draught: By comparing the Arrival Draught (e.g., 11.1m vs 9.2m), users can scientifically confirm whether the vessel arrived Laden or in Ballast, regardless of its reported AIS status.
Port Stay Metrics: This column tracks the exact time elapsed between arrival and departure. For instance, seeing a 01d 13h stay at Gate LNG allows logistics managers to benchmark terminal performance and calculate potential demurrage or port costs.
Voyage Time Audit: The system calculates the duration of the leg between ports. A significantly long Voyage Time (such as the 59 days recorded for the Sabine Pass leg) can alert analysts to unscheduled drifting, mid-sea waiting, or strategic slow-steaming.
Once you have completed your investigation of a single vessel, Orbify allows you to instantly scale your perspective by clicking on the Analytics tab. This view synthesizes thousands of individual data points into high-level visual intelligence. Instead of looking at one voyage, you can now see the Top Origin and Destination Hubs globally. This allows you to contextualize the vessel's behavior: for example, seeing if its visit to Gate LNG or Sabine Pass aligns with broader seasonal trends or regional dominance in the US or European markets. It is the final step in the Orbify workflow: turning granular vessel data into a macro-strategic advantage.
